Posts

What is GA4? How does it work? What is the primary difference between GA3 and GA4? Why should you switch to GA4 now? Read Here!


Why it is Important to Switch to GA 4 Now


Why it is Important to Switch to GA 4 Now

Google Analytics is one of the most powerful tools for marketers and companies. It monitors and analyzes website traffic and gives marketers massive amounts of information about web traffic, online users, their preferences, and ways they get to your website.

You can use Google Analytics to expand and grow your company if you run a small business or giant corporation. However, the older version of Google Analytics has a few downsides. For instance, it has limited dashboard capabilities, preventing you from customizing specific reports.

In addition, it also has missing information because it blocks cookies and switches off JavaScript to track visitors’ behavior. So, this leads to under-reporting due to inefficient data tracking.

The good news is that Google has the newer version of Google Analytics 4, also known as GA4. Today’s article will discuss GA4 and highlight reasons to make an informed decision on whether you should switch to GA4. Read on!


What is GA4?

GA4 is an analytic service that enables digital marketers and companies to measure traffic and engagement across platforms, including websites and applications. It is the newest version of Google Analytics and allows marketers and companies to track websites and apps using the same account.

In addition, it comes with cutting-edge reporting features and provides digital marketers with in-depth information and insights. GA4 has an entirely different data architecture, storage, and processing mechanisms than the previous versions.

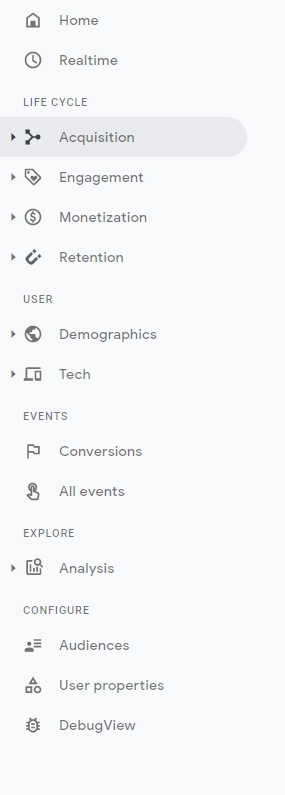
So, it provides new ways to track, measure, and analyze traffic for years. GA4 also looks different from Universal Analytics, with a changed navigation system and user interface.

Let us discuss why you should switch to GA4, but before that, knowing the difference between GA4 and Universal Analytics is essential. The purpose is to help you make an informed decision and let you understand whether GA4 is better than Universal Analytics.


GA4 Vs. Universal Analytics

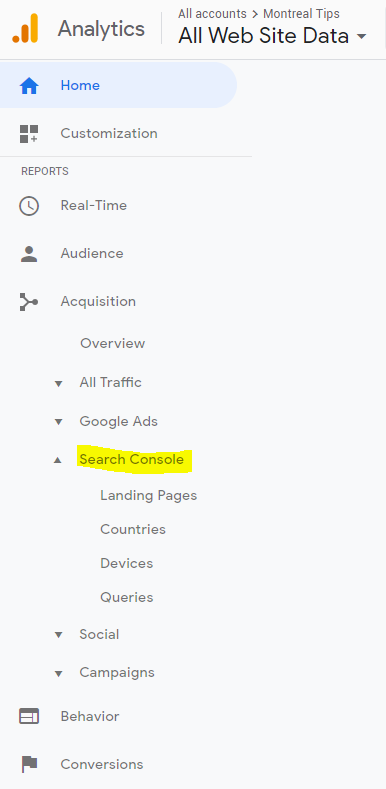
Although GA4 is similar to Universal Analytics or GA3, it has massive differences. If you have used the previous version, you will notice various changes in how the newest version looks and how the navigation works.

In addition to the user interface and navigation, GA4 has other differences from the previous version. Google makes substantial efforts to add more reporting capabilities and functionalities to GA4.

For instance, GA4 misses the bounce rate because Google has replaced it with engaging sessions. So, you won’t see the percentage or number of people leaving your website. Instead, you will see data on users who visit your website and stay on it to explore your products and services.

Therefore, the ” Engagement Rate ” is the new metric Google wants marketers and businesses to focus on is the “Engagement Rate.” Moreover, GA4 does not use “goals.” Instead, it uses events, meaning you can track events and conversions.

The good news is that you can choose events that count as conversions. Google will also track events without modifying your website’s code. GA4 also misses historical data. What does this mean?

If you have used Universal Analytics and created a GA4 property, you can’t move the historical data to that property. So, you start from scratch. However, your historical data will remain safe in Universal Analytics.

However, you have to switch to Universal Analytics to analyze the historical data. Let us now discuss the prominent features and benefits of GA4 to help you decide whether to switch from Universal Analytics to GA4.


Reasons to switch to to Switch to GA 4:

1. Access to In-Depth Metrics

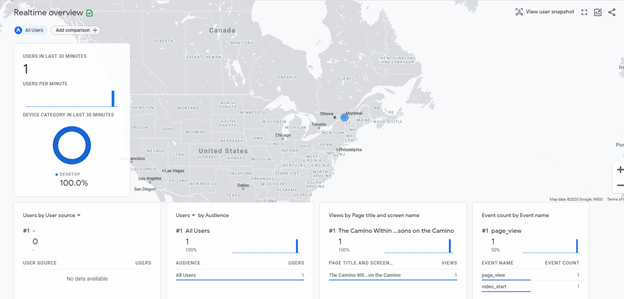
GA4 is one of the most powerful analytics tools, allowing marketers, data analysts, and companies to dive into user-centric and in-depth metrics. These metrics usually focus on the Lifecycle and the user.

Besides, GA4 uses user-centric metrics, data, and dimensions using artificial intelligence and machine learning algorithms to predict customer/buyer/users’ actions and implement more S.M.A.R.T tracking with predictive modeling or analytics.

Universal Analytics’ bounce rates have been replaced with more useful and valuable engagement metrics. For instance, when using GA4, an engaged session lasts ten seconds. It has at least one conversion event and involves two page views.

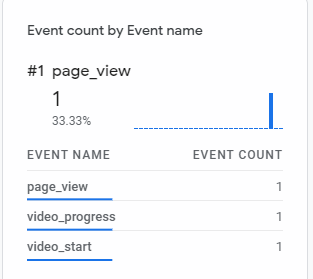
GA4 metrics allow digital marketers to leverage the power of events and measure engagements. It gives you a holistic view of website visitors, actions, and behaviors. The new feature, enhanced events, enables marketers to understand how their website visitors interact with the content. So, you can use “Enhanced Events” to:

  • Scroll data
  • Download files
  • Search about your site
  • Video and graphic engagement rates

So, this advanced level of event marketing is more sophisticated because it does not require custom code or a web developer’s assistance. Therefore, you can understand how visitors/users interact with your site, the type of content that compels users to click on CTAs, and what content requires optimization.


2. Track Customer/Buyer Journey

GA4 is an excellent tool to track customer or buyer journeys. The tool does not focus on measurements like fragmentation by device or platform, such as sessions. On the other hand, it focuses on users and their interactions via events.

These events happen across the website and application. For example, you can use GA4 Lifecycle to generate reports that align with different stages of the customer journey, including:

  • Acquisition
  • Engagement
  • Interaction
  • Monetization
  • Retention
  • Loyalty

So, you can use these reports to understand the buyer’s journey. At the same time, these reports enable you to identify gaps and complications and determine opportunities via insights. Thus, you can positively change your marketing strategy and make the most of it.

3. Quick Big Query Integration

Big Query is one of the most famous data warehouses. It helps you track, manage, and analyze data and has built-in features that can improve your overall business processes. These features are:

  • Machine learning
  • Geospatial analysis
  • Business intelligence

So, you can use Big Query and SQL to answer complex questions without deploying the infrastructure management. GA4’s integration with this data warehouse allows you to analyze massive datasets quickly.

At the same time, it performs advanced analysis of large volumes of raw data from GA4 and helps you generate valuable insights via machine learning algorithms. Similarly, you can combine data with these insights from other marketing and customer relationship management (CRM) tools. The purpose is to create a repository that gives insights into the customer/buyer journey.

4. Create Targeted Segments

GA4 enables you to create targeted segments for your digital marketing campaigns. You can create segments based on various factors, such as events and time, allowing you to group users based on interactions, events, and time. Remember, this also focuses on events and arbitrary device categories.

When you leverage the power of these measurements and analytics, you can create precise and targeted audiences with a complete picture of who is using your web pages and how they engage with your content. The purpose is to create endless possibilities and lead to more optimized conversions and sales.

Moreover, one of the most significant benefits of GA4 is that it automatically shares audiences with Google Ads. Thus, you can focus on paid advertising campaigns for website visitors who follow a specific behavior pattern.

When you have more targeted audiences, you can optimize campaigns and reach your audiences at the right time. More sophisticated marketing campaign strategies and audiences can generate higher ROIs.

5. Automatic Alerts

GA4 uses machine learning algorithms and models designed and developed by experienced professionals working in Google. Thanks to machine learning algorithms, you can receive automatic alerts when trends appear in the data. For instance, if your business sells more of a specific product, GA4 will let you know before you see an increased number of sales.

So this enables you to respond fast and contact suppliers to keep the product in stock. GA4 also helps marketers and businesses to predict behavior among specific customer groups.

For instance, the tool creates models that can measure the potential revenue of a customer group. It also calculates churn probabilities of different customer/user/visitor segments.

6. Realistic Marketing Campaigns

GA4 is one of the best ways to create realistic marketing campaigns because it helps you unify your website and app data. GA4 also provides a future-proofed solution even if you don’t have an application. However, this is valuable if you have planned to develop an app in the future.

In addition to synchronizing your website with app data and analyzing customer journeys across platforms, GA4 enables you to analyze user behavior by their position in the purchasing funnel based on factors like awareness and conversion.

A better understanding of how customers/visitors/users behave at different stages allows you to create a more sophisticated marketing strategy. For instance, if you notice that your product sales are due to a coupon or discount strategy shared on Facebook or Instagram, you can invest more on these social networking platforms.

7. Future-Proof Design and Privacy

Future-proof design is one of the most significant advantages of GA4. It focuses on user privacy because it moves away from cookie-based tracking. Therefore, switching to and using GA4 is an excellent way for marketers and businesses to streamline their data operations.

GA4 provides you with sophisticated solutions without depending on cookies. Although Google recognizes that some data gaps may occur with this approach, the company makes substantial efforts and uses accurate modeling techniques to overcome these complications.

8. Leverage the Power of Explorations

“Explorations” is one of the most powerful features offered by the newest Google Analytics. It accommodates specific goals and lets marketers create reports via data visualization and analytical techniques.

Although Universal Analytics has a similar feature, it requires marketers and businesses to pay money using Google Analytics 360 users. However, this is a free feature with GA4.

In addition, “Explorations” allow you to track content, research audiences, and optimize conversion rates to the next level. You will find ready-made “Explorations” in the template gallery. These templates/explorations can help you analyze specific marketing areas, including:

  • Funnel performance
  • User segment overlaps
  • Lead acquisition performance
  • User cohorts behavior
  • User lifetime value

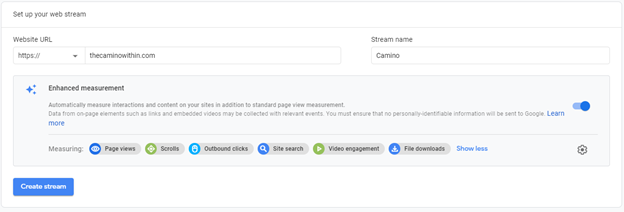
Getting Started With GA4

Although switching to GA4 from the previous version of Google Analytics is daunting for many businesses and digital marketers, it is worth your time because it streamlines your online data and provides you with tools to create realistic, user-oriented, and time-bound marketing campaigns.

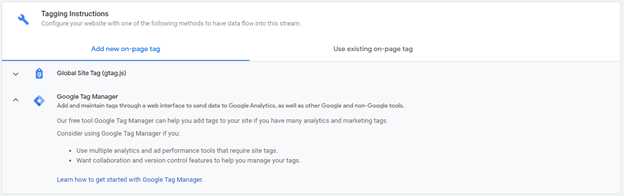
There are a few ways to get started with GA4. For instance, you can add GA4 to your website that you currently analyze with the older version. So, if you are familiar with the previous version, you can use this option to streamline the entire process.

Google’s setup assistance adds the GA4 property to the already existing one. Bear in mind that the older platform will collect data until July 2023. So, you can switch between the older and newer version based on your needs.

If you need help getting started, feel free to connect t@rimanagency.com


Final Words

Companies collect user/customer data from various channels, including websites, apps, eCommerce platforms, and social media. GA4 is a cutting-edge tool to create comprehensive customer profiles using the collected data, gain insights into users’ behaviors, and provide more personalized experiences to your customers using effective, reliable, and user-oriented marketing campaigns.

If you find it challenging to get started with GA4, you can hire Riman Agency to streamline the process. We have a team of qualified, experienced, and skilled data analysts and digital marketers with an in-depth understanding of GA4. Contact us today for more information or discuss your requirements with our professional team. Until Next Time!

The NextGEN of Google Analytics is Here

Google has just launched their new and improved Google Analytics 4.0, extending beyond Universal Analytics. The New GA relies on AI and machine learning to create predictions for traffic, conversion, products, etc. What does this mean for businesses? Read on for 10 key things to know, as well as a deeper dive into this exciting update to Google Analytics.

10 Key Things to Know About GA 4.0:

  1. It no longer requires coding or GTM for event tracking.
  2. You can access 4.0 from your current Analytics account by going into Admin 🡪 Property (Create new property) 🡪 Select (Web and app) 🡪 where you can track your website,  mobile app or both.
  3. It is moving away from cookies and will no longer use third-party cookies to track performance. 
  4. GA 4.0 is where AI meets data for marketers.
  5. You will have access to predictive metrics and customer lifecycle metrics.
  6. It provides more granular data control.
  7. It allows improved cross-device measurement & tracking.
  8. It allows deeper integration with search efforts on Google Ads.
  9. Google will be investing more in Analytics 4.0, and will stop updating the older version. 
  10. While GA  in the past was divided into Acquisition, Behavior, Audience, and Conversion reports, the new platform is divided into Life Cycle, User, Events, Explore, and Configure.


What This Means for SEM & Google Ads

As we know, Google Analytics is the backbone of a strong SEM strategy, enabling us to make data-driven decisions and immediately adapt to market changes, test results, trends, etc.

With GA 4.0, we now have better audience integration, empowering better exclusion and audience selection based on actions taken across devices and platforms. This means you will be able to see, for example, if someone came from the web, but ended up converting from desktop, which could open up whole new channels for understanding the customer journey.

From a user behaviour standpoint, Google has introduced more user-centric metrics such as LTV (Life Time Value) and expected average churn rate, empowering more informed long term strategies.

GA 4.0 will also allow you to set up enhanced measurements to automatically measure interactions and content on your site, in addition to standard page view measurement.

Additional Measurement in Google Analytics 4.0

In this example, you can see on the dashboard right after being set up where GA captures the Page View + Video Progress + Video Start as part of the enhanced measurement features. See below: 

Event tracking GA 4.0

This means, you will no longer need to code or use GTM to track specific actions on-page, making it easier and possibly faster for marketers. This is especially beneficial for marketers who do not have the know-how or access to make code changes, or in organizations where code changes need to go through approvals or a potentially lengthy ticketing process. 


Why You Should Set Up 4.0 (aside from the benefits)

In their update, Google noted that they will be investing in the new platform moving forward and, therefore, moving away from the old one. Your current GA account will still be fully functional, but this likely means that things like support, bug fixes and updates will be phased out, so it’s a good idea to upgrade now.

Learn more: https://support.google.com/analytics/answer/10089681#start


How To Get Setup

The first step is to know what account type you currently have. If you were part of the GA 4.0 beta program, your account would have been known as “App + Web properties”. If you were not part of the beta, your account type would now be known as “Universal Analytics”. 

If you have a Universal Analytics account, you can easily create your new GA 4.0 property from your existing one, meaning you won’t lose your current data. The link above will give you the information you need to do this.

Note: If you did not previously have a GA account, GA 4.0 is now the default, so you would automatically get it upon setting up your account.

Tagging 

When it comes to tagging, you can continue to use existing on-page tags or add new on-page tags. Currently, there are no benefits or downsides to either choice, this is a matter of preference.

Tagging in Google Analytics 4.0

Here is a sneak peek into the new GA experience look and feel:

Real-Time Reports 

Google Analytics 4.0 Real Time Reporting

New Categorization

As mentioned earlier, the previous categorization of Acquisition, Behavior, Audience, and Conversion reports has been updated to Life Cycle, User, Events, Explore, and Configure. Here’s what that looks like:

Google Analytics 4.0 New Navigation

The Bottom Line

Love it or hate it, Google Analytics 4.0 is here to stay, and there’s no question that the platform is getting more powerful with each iteration. What are your thoughts on the new GA?

Sources:

https://searchengineland.com/google-analytics-4-adds-new-integrations-with-ads-ai-powered-insights-and-predictions-342048

https://blog.google/products/marketingplatform/analytics/new_google_analytics

https://support.google.com/analytics/answer/9445345?hl=en

Google Analytics Most Important Metrics

Google Analytics (GA) is one of the most powerful tools a business can adopt, and one of the few exceptions to the “you get what you pay for” rule. It’s incredible how much valuable data you can get from a free tool. Valuable and actionable data.

However, the sheer volume of data and metrics available can feel daunting to people who aren’t familiar with analytics. What’s most important? What should you focus on? What should you tackle first? Every business is different, with different goals and markets, so what you focus on will depend on that. But, there are several metrics that can provide great value to virtually every business.

Whether your aim is to improve your search engine rankings, keep people on your site longer, increase onsite conversions, raise brand awareness, etc., these five Google Analytics metrics should be featured on every business’s GA dashboard:

Guy Typing on his mac book

Photo by Austin Distel on Unsplash


Here is the list of the most important Google Analytics Metrics:

Bounce Rate

This is the percentage of visitors who arrive on your site, then leave (i.e. close their browser window or tab, or navigate to another website) without accessing any other pages within your site.

Through GA, you can check the bounce rate of your site overall, as well as the bounce rate of individual pages. Checking the stats of individual pages gives you a good picture of your most engaging content and the content that most often leads to people dropping off. For pages where people stay and decide to explore more, you’ll want to boost visibility of those pages, use them as landing pages and try to create similar (but not duplicate) content on other pages.

For pages where people are dropping off, you’ll want to investigate how to improve those pages to reduce bounce rate, and potentially reduce their visibility by no longer using them as key landing pages while you’re working on improvements.

Time on Site

There are two reasons to watch this metric closely. First, search engines are giving more and more weight to ‘time on site’ as an indicator of the value and/or credibility of a page or overall website. It’s a good measurement because people spend more time with content that’s engaging, educational, useful or entertaining. Search engines like Google want to provide users with good content, so it makes sense that they’d rely on behavioural metrics like this one.

The second reason is that it’s an indicator to you of how engaging and useful people find your content. If people are just clicking through pages then dropping off, your content isn’t doing its job. But if they’re spending time with it, it means you’re doing something right.

Again, you’ll want to look at the overall time on site, but mainly focus on individual pages to see which ones are really striking a chord with your audience and which ones could do with some strategic optimization.

Pages Per Visit

Pages per visit is another indicator of engagement, but can also tell you if your site is easy to navigate, which matters to both your visitors and search engine spiders.

If you have a consistently low pages-per-visit rate, one of the first things you want to investigate is your site’s navigation. Are the links or menu items easy to find? Are the links actually working? Are they rendering properly across all browsers and devices, including mobile? Investigate all of this and consider getting someone unfamiliar with your site to give it a try and provide feedback.

If your navigation is visible and accessible, but you’re still seeing a low pages-per-visit rate, then it’s time to look at your content. Look at what they’re seeing first, where they go from there and where they’re dropping off to determine what might need to be optimized.

Conversion Rate

What does “conversion” mean? It will differ from business to business, project to project. It could be a sale, sign up, registration, download… whatever you want people to do on your site, that’s your conversion. Many businesses have several variations of conversions, including macro and micro conversions. For example, a sale or registration could be a macro conversion, whereas a newsletter signup or ebook download might be considered a micro-conversion.

Conversions matter because they’re kind of the whole point of your website. They’re what keep you in business! This is another instance where you will want to drill it down to individual pages to determine the type of content that is most likely to convert, and for which of your conversion types, and what content does not convert well.

Visits and Returning Visits

Person looking at Google Analytics on their phone

Photo by Austin Distel on Unsplash

In GA, new visits are people who have never visited your site before, whereas a return visitor is just that – someone who has been to your site before and is now coming back. Google Analytics does set a two year expiry, so if someone visited your site more than two years ago and is now returning, they will be counted as a new visitor.

You want to watch these metrics because a steady stream of new visitors means any marketing investments or search engine optimizations you’ve been making are paying off (in this case, you’ll want to look at where those visits are coming from to determine which of your investments are working and which are not). If you aren’t seeing noticeable spikes in new visits to coincide with campaigns, that’s an indicator that something has gone wrong. Either the content isn’t engaging enough, or there could be a technical issue like a broken link. This needs to be investigated ASAP.

Returning visits are yet another indicator of how engaging your content is to your audience. If people aren’t coming back, it could indicate an issue with your content, service or products. In this case, you’ll also want to look at where visitors are coming from. For example, are you investing in advertising that brings a lot of initial visits, but not quality visitors that come back again and again? What areas are driving traffic that converts to returning visitors? Invest in more of that and reconsider investments that aren’t driving quality traffic your way.

Takeaway

Never before in history have marketers, business owners and entrepreneurs had such a wealth of data available right at their fingertips. That brings a lot of advantages, but also this whole new problem of too much data to know what to do with it all! Instead of trying to analyze and act on all of it at once, aim to focus on a few key areas to start. Analyze reports, tweak your content and strategies, test, measure, analyze and update over and over again to continually improve your efforts, keep things fresh, respond to the market and grow your business.


Learn how to setup Google Analytics here. 

Get your copy of: “The Secret to Capitalizing on Analytics”

Google Analytics Permissions Guide

Google Analytics structure is important when it comes to giving permissions and delegating rights to teams and individuals. For example, you may want to permit some people to view reports, but not make changes within the Google Analytics platform, whereas you may want to grant someone else permission to edit dashboards and create filters. The structure is a key part of that.

You can delegate four types of permissions in GA. Permissions can be granted at any level of the GA structure (Account, Property and View). Permission types include:

Manage Users (Permission): This allows someone to remove and add user access to the account.

This is a dangerous right to hand off, especially given the fact that if you grant this level of permission, you might be kicked off the account yourself. Ideally, only one person should be able to add and remove users. This way, you have better control over who has access, and what level of access they have, to your incredibly valuable data.

Edit (Permission): This allows someone to edit accounts, properties and views, filter data, and create goals. The only thing they can’t do is manage users. This permission level is ideal for Analytics experts.

Collaborate (Permission): This allows someone to edit shared dashboards or add annotations. This permission level is ideal for marketers, social media managers, and campaign managers.

Read & Analyze (Permission): This is a read-only level. It allows someone to read and view reports, but they cannot make any changes. This permission level is ideal for CEOs, managers, etc.

Note:

It is important to note that while you can grant permission at either the account, property or view level, that permission is hierarchical. That means, if you grant someone permission at the property level, they will automatically have access at the view level as well. Grant it at the account level, and they automatically have it at the property and view levels.

List of permissions in Google Analytics


Learn More about analytics and how to capitalize on it: Get your copy of “The Secret to Capitalizing on Analytics” here

How to set up a Google Analytics Account Structure?

While setting up your account it is hard to foresee where the account will be in the future. Yet there are some factors that you should always account to, to ensure that your account is setup to grow in a sustainable manner.

Here are 6 factors to keep in mind when setting up your Google Analytics Account:

  • Keep in mind that GA is there to serve your marketing and business strategy.
    As much as the setup is important, it is more important to check it daily. Most successful marketers and business people check their analytics almost daily. It usually guides their decisions to be more data-driven. As you design your structure, think about how you will use it daily.
  • Don’t forget the purpose of data and GA. The main reason to use GA is to make sure visitors are doing what you want them to do on your site or web property. This could be contact form submission, sign up to a newsletter, buy a product, request a quote, etc. When setting up GA remember your KPIs and goals for the site.
  • Remember that a big strength of GA is the ability to integrate with all the other Google tools. Keep in mind that you will likely be connecting your GA account with Google Ads, Google Search Console, Google Tag Manager, Google AdSense, etc.
  • Another strength of GA is the ability to customize reports to your needs. As you go through the process of setting up GA, keep in mind how you want to view the data. Better yet, always bear in mind who will benefit from what report. When we approach the end of this book where you’ll learn how to customize data, bring these thoughts to life through the right dashboards.
  • Through GA, you can compare data across different months, traffic sources and other dimensions. As you analyze different reports, remember to make data more relevant through comparing.
  • Remember that GA can do (much of) the work for you. You are better off creating intelligent alerts to notify you of a rise or drop in traffic or any other significant change with your site data, rather than relying on manual daily checks.

Learn More about analytics and how to capitalize on it: Get your copy of “The Secret to Capitalizing on Analytics” here

Google Analytics Structure

GA is divided into three levels.

The account level: This is where you label your group of properties. Every account can have up to 50 properties.

The property level: This is where you manage all your web properties. A web property could be an app, a website, a POS, etc. Any property that is solely yours could be here. For example, you own your mobile app, so it can be tracked as a property. You don’t own your Facebook page – that’s the property of Facebook – so it can’t be tracked as a property. Each property can have up to 25 views.

The view level: This is where you select the different ways you can view your property. One unfiltered view for every property in your account is automatically created. You can set up multiple views on a single property.

Let’s use an example to better understand this structure:

I run a business called The Camino Within. Let’s imagine it has a blog, speaking site, book site and a mobile app. These are all separate properties, meaning the blog, for example, is not embedded within the main website, but has its own URL.

The account name would be:

  • The Camino Within

The property names would be:

  • The Camino Within site – thecaminowithin.com
  • The Camino Within blog – blog.thecaminowithin.com
  • The Camino Within travel app – IOS & Android apps
  • The Camino Within speaking site – speaking.thecaminowithin.com

A good example of the views could be as follows:

  • All data view
  • Canadian visits
  • International visits
  • External traffic only
  • Backup view

With views, you apply filters so that you only see the data you want within that view. This makes it really easy to quickly extract your most relevant and frequently needed information. Just note that when you’re in a particular view, you won’t be able to retrieve any information that you’ve set to be filtered out. You’ll need to remove that filter or choose another view. Also, be sure to label your views very clearly.

Google Analytics Structure

As you will learn further along in this book, this structure is important for permissions, account management, integration and accessibility. For this reason, take care that your GA structure makes sense for you, your business and your business objectives.

Takeaway

Google Analytics account structure is an important factor in collecting and compiling the data most relevant to your business goals, in a way that makes sense for you. When setup properly, it will help considerably in the long-term planning, preparation and performance of your business online.


Learn More about analytics and how to capitalize on it: Get your copy of “The Secret to Capitalizing on Analytics” here

SUCCESS IN GA REQUIRES 3 STEPS

Like all tools, GA is only as effective as the person wielding it. Take the time to get to know the tool and how best to use it within your business. These are 3 key steps you need to invest in to ensure success with GA:

  1. Setting up Google Analytics in the right way
  • Creating a Google Analytics account
  • Customizing the account
  • Understanding the structure
  • Understanding how you can create views and properties for your account
  • Understanding how to distribute privileges
  • Understanding how to activate features
  • Understanding GDPR, privacy and Google Analytics


  1. Translating your data into insights
  • Understanding metrics and dimensions
  • Understanding data hygiene
  • Knowing where to find relevant data
  • Understanding what this data means for your business
  • Understanding what is working and not working
  • Getting the most out of the data


  1. Acting on your insights
  • Applying learnings to your business
  • Knowing how to react to data
  • Optimizing for better results


Lessons from GA Consulting

When I work with companies, I always work on getting to know the client first, understanding their business and their goals.

After that, I aim to create a Google Analytics account setup that is fully aligned with their goals.

To go the extra mile, I also help them with reporting, insights and dashboarding.

So, the process goes like this:

  • Understanding who you are and what you want to achieve;
  • Customizing your account to gather and compile data that’s relevant to who you are and what you want to achieve;
  • Creating reports and dashboards that give you easy-to-interpret visuals of what your data means.

But here’s the crazy part: even though the client is the person in this equation who best knows the business, they always want me to be there to act on their insights, data and reports.

What this taught me is that data is more than just marrying our minds with numbers. In fact, it’s not a marriage at all. It’s more of a master and machine relationship. YOU are the master. You need to make the machine work for you.

Every time I sit down with a client’s team to go over their data, we always end up with more than just the sum total. We always end up with genius ideas and actionable next steps. The data becomes an impetus to launch creative new ways to market and cater to customers.

The ability and drive to interpret and act on data is there, but for whatever reason, many people need to be led to the water, so to speak.  Don’t ever play the passive or reactive role to data. Be involved at every level. Data will not act alone. It needs you in the driver’s seat. Get yourself in that mindset.

To bridge this gap between gathering the data and acting on it, I divide analytics consulting into setting up, researching and recommendations. For this, I like to use the metaphor of producing a Broadway play.


Prepare. Practice. Perform. Here’s how it goes:

Prepare

  • Get to know the structure of your GA account.
  • Learn how to create a Google Analytics account.
  • Learn an alternative way of adding GA through a tool called Google Tag Manager.

Practice

  • GA uses some terms you may be unfamiliar with. Learn the most important metrics and dimensions so that you are able to read the data on GA reports.

Perform

  • Navigate the platform.
  • Read and analyze GA reports.
  • Act on the knowledge and insight they provide.


Takeaway

Having data without interpretation is like trying to perform in a play without a script.

Don’t ever play the passive or reactive role to data. Be involved at every level. Know the tool, learn how to wield it, then do it.


Learn More about analytics and how to capitalize on it: Get your copy of “The Secret to Capitalizing on Analytics” here

GOOGLE ANALYTICS & SEO


The Search Engine’s Mission

The role of search engines is to crawl the web and index the pages that they deem worthy, in an order that provides value to users.

In doing so, their mission is to ensure users can quickly and easily find the information, products, services or content they’re looking for.

Google’s mission statement, written in 2013, is as follows: “Google’s mission is to organize the world’s information and make it universally accessible and useful.”

Source: https://www.google.com/about/


Bing’s mission statement, also written in 2013, is as follows: “At Bing our central mission is to help you search less and do more. To that end, we’re constantly looking for ways to make your search experience more efficient.”

Source: https://blogs.bing.com/search/2013/08/23/find-it-faster-with-bing-product-search/


Yahoo’s mission is to “make the world’s daily habits inspiring and entertaining.”

Source: Yahoo.com


What can we take away from this?

Essentially, search engines exist to send us away from them and to what users search for. Ironic, isn’t it?

Google Search Console on Google Analytics

Google Search Console on Google Analytics


Think about it. You visit a search engine, perform a search and then leave. The better the experience you have with a search engine (i.e. the greater success you have at finding what you want) the more likely you are to use that one again. With that in mind, you can rely on them wanting to return search results that are as closely related as possible to what it thinks” you are truly looking for.

There is a lot to learn from this.

My grandpa used to say, “Tell me what someone wants and I will tell you how to control him.” And I tell you today that if you want to control how your web property shows up in search engines, you have to understand that the primary mission of the search engine is around what people want and nothing else. Yes, the companies behind them want to make money through advertising, sales, etc., but they know that these things are most profitable when driven by that primary mission of providing value.

User driven metrics control search, and likely always will.

If you are able, through your site, to provide useful, accessible, engaging, inspiring and entertaining information, then you are golden. If people want you, search engines will want you. This should be the guiding principle behind your SEO strategy.

Thankfully, GA can help you understand what searchers want, like, enjoy, engage with and how you can act on that knowledge to improve your ranking.

Google Search Console on Google Analytics                                                               

Going back to chapter 14, where we installed Google Search Console, you may recall that GA alone is not enough for us to capture adequate data to take a knowledge-driven approach to SEO.

To be able to make educated SEO decisions, you need Google Search Console. Once you connect Google Search Console data to your web property, you will have access to a wide array of reports that will help you understand how pages are performing, what keywords are sending the most traffic, what pages are getting the highest engagement, what is relevant and what is not.

The goal of this chapter is to help you capitalize on GA to optimize your site’s organic search performance in the best way possible.

Let’s jump back to the GA dashboard.

Under “Acquisition” scroll to “Search Console”.

Without Google Search Console, the default analytics results are extremely limited. In fact, GA will often return “Not Provided”.

With Search Console, you will have access to extensive data, which is enough to optimize, improve and plan ahead.

Also, Google Search Console is the best SEO tool out there that you can use for free. Make sure that you are using it and learning from it as much as possible.


Search Console Landing Pages Report

Search Console Landing Pages Report

Search Console Landing Pages Report

As you can see in the report above, GA provides a list of the most popular landing pages on your site that visitors have arrived at through organic search.

The table shows a lot of valuable info, which is the result of the merge between Google Search Console data and on-site behaviour data. This helps you not only know what people did to find your page, but what they did once they arrived there, and whether they took the actions that you want them to take.

These are the terms you should know to get the most out of this report:

SERP (Search Engine Results Page) Impressions – This is the number of times your pages popped up in search results.

Clicks – The number of times people clicked on your page from an SERP.

CTR (Click Through Rate) –  The number of clicks/the number of impressions * 100, meaning, it reflects the rate at which people see your listing in organic search results and choose to click through to your site.

Average Position – This is the average ranking of your page in organic search results, taking into account all the keywords that this page ranks for. If your page has an average position of 3, for example, that means your page usually shows up around the third spot in SERPs (which is a very good position to have).

Sessions – This is the number of visits that you get to your site from organic search.

Bounce Rate – This tells you how many visitors to your site (from organic search) left without taking any action.

Goal Metrics – This shows how your traffic from organic search is converting on the site.

The Landing Page Report gives you a view into how your different pages are performing from an SEO perspective. It helps you see what pages are performing well, which ones can be improved, and which pages you can capitalize on elsewhere, maybe through paid search or social campaigns.


 Acquisition Google Search Console Countries Report

 Acquisition Google Search Console Countries Report

 Acquisition Google Search Console Countries Report

In this report, you can see the amount of organic search traffic you’re getting from each country.

This insight can help you tailor future content for different countries, with different languages and different information that caters to specific audiences.

I use this report to understand who is coming to my site and how I can tailor new content for them. It also helps me identify opportunities I may be missing out on. For example, if I’m getting a lot of traffic from a specific country, but it isn’t converting, I can start looking into why that may be, and what I can do to better serve that traffic and increase conversions.

In the sample report above, you can see that the US is the second biggest source of traffic to my site. Because of that, I try to tailor some content to that audience instead of only concentrating on Canadian traffic or local traffic.


Acquisition Google Search Console Device Report

Acquisition Google Search Console Device Report

Acquisition Google Search Console Device Report

As small as this report is, it packs a big punch.

This gives you a quick overview of where you stand as a brand and site, as it shows your average position on mobile, tablet and desktop.

If you see that you have a lower than usual CTR on mobile, for example, it may be a sign that you are not appealing to users of these devices. You may find that you need to a better job with meta title and meta descriptions, or even that your site isn’t rendering properly on mobile devices

Acquisition Google Search Console Queries Report

Acquisition Google Search Console Queries Report

Acquisition Google Search Console Queries Report

This report is, for SEO purposes, the most important one in the Google Search Console reports, as it shows what terms and keywords visitors used to arrive on your site.

This shows what you’re good at and what you can improve, in terms of keywords.

It is a great place to see what type of content to concentrate on more, and gives you the start of a model for how to approach future content and what types of terms to concentrate on for a more targeted and sustained approach to the details on your site.


Takeaway

GA, in partnership with Google Search Console, helps you understand how visitors search for your site, how they perceive it and if they find it relevant, giving you a starting point from which to build and improve on your content strategy for better SEO.

What makes GA so important as a tool, is that it taps into user metrics, and these user metrics are the main ranking factors of any website, as of this writing.


This is based on chapter 18 from the book “The Secret to Capitalizing on Analytics”


How to use analytics to create good content.

Are You Missing the Boat on Data-Driven Content Marketing?

Do you want high performing content? Don’t we all!

In working with a variety of companies, from small startups to Fortune 500s, I’ve learned that analytics is a tool not capitalized on enough, especially when it comes to content marketing. Even big companies, with huge marketing budgets, are missing the boat.

Interestingly, analytics (whether Google Analytics or another tool) tends to be looked at only after a paid campaign, end of the season, or before the end of the year. Sadly, most companies don’t even consider looking at data pre-campaign, which is a huge missed opportunity.

The more I work with analytics, the more I realize this powerful data should be considered in all phases of a campaign, especially when it comes to content marketing.

Why? Because analytics doesn’t just tell you what worked, it can also help you predict what will work in the future and what to use to make it work… if you look in the right place!

That’s why, when the time comes to create relevant, engaging content, I look to 5 main Google Analytics metrics.

Here are 5 ways to use Google Analytics in your content marketing strategy:


1. Site Content

In Google Analytics, just under Site Content, you can see the pages on your site that get the most visits. This gives you insight into your most popular topics or content types, allowing you to predict the topics and formats that are most engaging and appealing to your visitors.

Look at your bounce rates, exits, and avg time on page as well.

With this data, you will be able to plan future content either by using similar content structure, similar topics, or even a similar general approach.

Site Content Report from Google Analytics


2. Site Search

If you have site search capabilities built in, Site Search metrics is the best way to see what people look for once they arrive on your site.

Are people searching for something you don’t have a lot of content on? Or maybe you do, but they’re using different terms and not finding what you have?

Knowing what people are looking for is like having a crystal ball, telling you what content to create or enhance.

This can tell you how to cater to new visitors, align your content strategy with current customer needs, and know what content to use in ads and promotions.

Site Search Report


3. Audience Details

What type of people are visiting your site? This can help you determine the type of content to deliver. For example, you may discover you have a large millennial or baby boomer audience you can tailor content to. Perhaps you have high traffic from a particular country and you can adjust some existing content to have a more local flair.

When it comes to audience details, there can be many factors to consider.

To make better sense of the numbers, I usually look at at least 3 months of data to get more content-worthy metrics, and look at these key metrics:

  1.       Demographics (age and gender).
  2.       Interests (affinity categories and in-market segments), which help me understand the general and related interests that my visitors have, allowing me to create better content and target them in my social or search campaigns.
  3.       Geo (language and location). Pay close attention to language. Over time, you may notice a growing traffic segment associated with another language, or that there is potential for expanding your market.

Knowing these metrics will help you create the right content, for the right age group, at the right place, at the right time.

Demographics (age and gender)


4. Channels

‘Acquisition’ is the way in which you acquired visitors. It is where you will find the top sources of traffic to your site. For example, you can acquire visitors from Google, referrals from other sites, article mentions, newsletters and more.

Knowing how you got your current visitors will help you understand how your content is being shared, searched and viewed, and which content is best at drawing people in.

Knowing this empowers you to create content catered to the different visitors in your different channels, and create even more of the type of content that is best at bringing new visitors to your site.


5. Search Console

Under ‘Acquisition’ in Google Analytics, there is an important section called ‘Search Console’. This section is functional when you link your Google Analytics with Google Search Console.

Search Console reflects traffic from organic search, meaning you can see which keywords or queries in Google are leading people to your site. You will also see how well you rank for these keywords, and the number of impressions you get for them.

This data will allow you to assess what is working as far as search goes, help you further capitalize on these topics, and empower you to work on better and more relevant content for your site.

Google Search Console Tools Report on GA


Takeaway

Analytics can be a big part of creating great content. Taking advantage of analytics BEFORE creating or modifying content makes it part of a truly powerful cycle of creating content, seeing how it works on your web properties and sites, realigning your content strategy in accordance with the data gathered, and back to creating content. The big difference being, your content gets better, more relevant and more engaging each time.

If you use analytics (and you should), make sure you are using it to its fullest potential and your fullest advantage. Always check your data and analytics. Listen to what they are telling you. Make them an essential part of your overall marketing strategy and you will begin to see your content performing better than ever before.